Local procurement
Règles de calcul du score transport
A transport score is assigned to each country in order to promote local supply. It is constructed by calculating the carbon impact of the journey of goods between the country of origin and Belgium.
The carbon impact of this trip depends on 2 criteria:
the distance between the origin and the destination
the mean(s) of transportation used
The calculation method and the assumptions related to these criteria are detailed below.
Distances
The distance between the country of origin and the country of destination is calculated from the geographical center of the country of departure and that of Belgium.
For each rail or sea route, 2 truck journeys are taken into account: one in the country of origin between its geographical center and its nearest place of embarkation, the other Belgium its place of disembarkation on closer and the center of Belgium.
The routes were established using the following tools:
Means of transportation
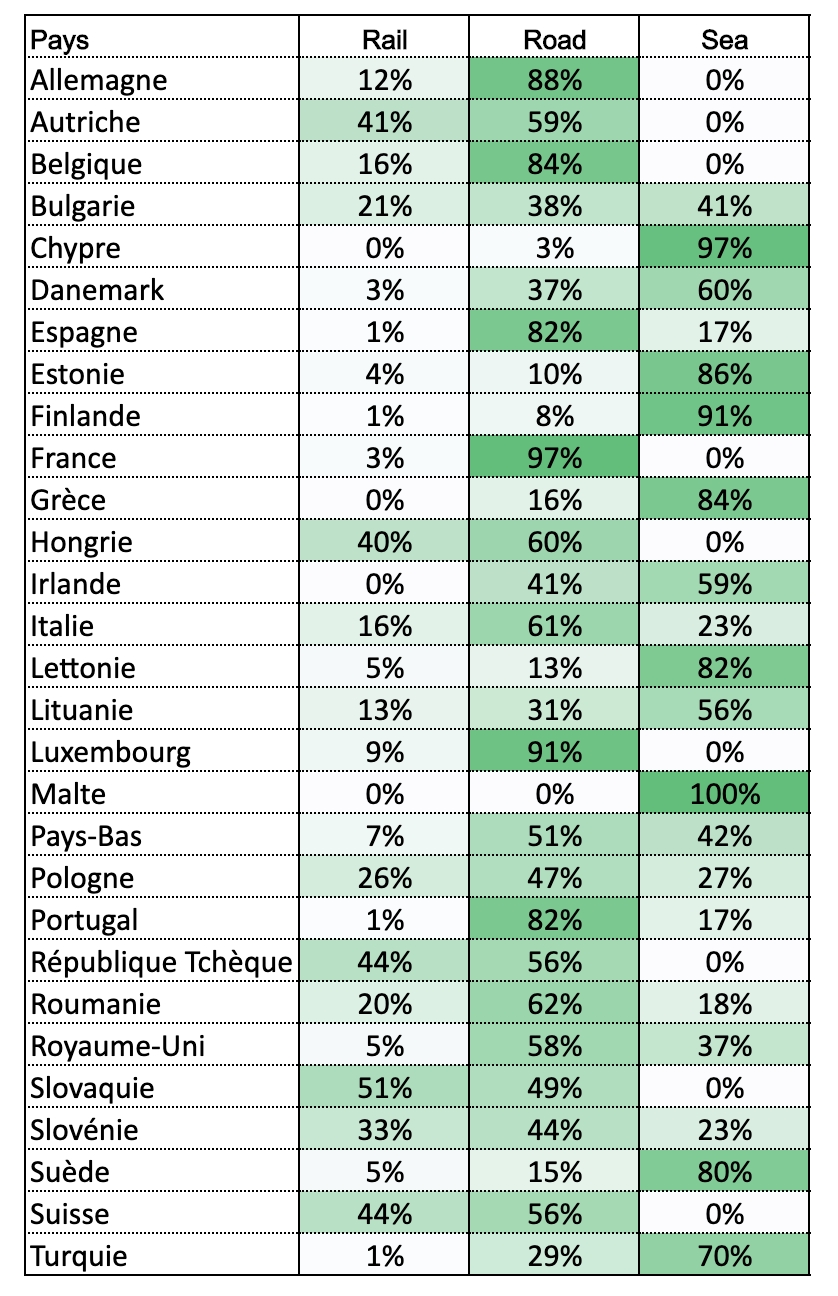
For European countries, the score is weighted according to the mode of transport used between the country of origin and France. Due to the lack of specifically Belgian data, and its proximity to France, the same assumptions were used to model the modes of transport to Belgium.

For countries outside Europe, the modal mix considered is 100% maritime.
CO2 impact measurement
The CO2 impact data (in gCO2e/t.km) come from the Carbon Base (ADEME).
Means of transportation
Geographical area
Description
CO2 eq / t.km
Road
World
Articulated - 34 to 40 tonnes - Road diesel, incorporation of 7% biodiesel
79g
Railway
France
Train - Medium engine - Medium load
7g
Railway
Europe
Freight train
22g
Maritime
Europe / Mediterranean
Cargo - 10,000 to 20,000 tonnes - HFO-MGO
13g
Maritime
Trans-Suez
Container carrier - Dry - Trans-Suez
7g
Maritime
World
Container carrier - Dry - Trans-Atlantique
11g
Scores by country
The transport score calculated by country using the above methodology is available here :
🇧🇪Score by country - BelgiumScore calculation
The following formula makes it possible to obtain the transport score on 100 points, taking into account ingredients involved in a recipe:
the number of ingredients the transport score associated with the country or fishing area the percentage of the ingredient present in the recipe
The transport score is integrated into the overall product score in the form of a bonus of up to 15 points. The transport bonus is calculated as follows:
corresponds to the transport score
Sources
ADEME (2020). Base Carbone - Transport de marchandises. https://www.bilans-ges.ademe.fr/
OECD/ITF. (2015). The Carbon Footprint of Global Trade, Tackling Emissions from International Freight Transport. https://www.itf-oecd.org/sites/default/files/docs/cop-pdf-06.pdf
EUROSTAT. (2009). Panorama of Transport. https://ec.europa.eu/eurostat/documents/3217494/5711595/KS-DA-09-001-EN.PDF/9c90d489-5009-4acc-9810-ae39612897d3
FAO. (2020). Matrices du commerce détaillées. FAOSTAT. http://www.fao.org/faostat/fr/#data/TM
MINISTÈRE DE LA TRANSITION ÉCOLOGIQUE ET SOLIDAIRE. (2020). Données sur les flux de marchandises (SitraM) - Année 2015 | Données et études statistiques. https://www.statistiques.developpement-durable.gouv.fr/donnees-sur-les-flux-de-marchandises-sitram-annee-2015
CIRED, SOLAGRO, EDF R&D, FIRE, & PhiLabs. (2019, janvier). L’empreinte énergétique et carbone de l’alimentation en France de la production à la consommation. http://dina.centre-cired.fr/IMG/pdf/empreinte_carbone_alimentation_en_france_fr_052019.pdf
OECD/ITF. (2015). The Carbon Footprint of Global Trade, Tackling Emissions from International Freight Transport. https://www.itf-oecd.org/sites/default/files/docs/cop-pdf-06.pdf
ALPIFRET. (2011, décembre). Observatoire des trafics marchandises transalpins. https://ec.europa.eu/transport/sites/transport/files/modes/road/doc/2011-12-annual-report-observation-trafics.pdf
Ministerio de Fomento. (2018, mai). Observatorio hispano-francés de Tráfico en los Pirineos - Documento No 8. https://www.mitma.gob.es/recursos_mfom/informe_otp8.pdf
Last updated