🇧🇪
Green-score Belgium
EN
EN
  • 🇧🇪Presentation
  • Methodology
    • General operation
    • Life cycle analysis
    • Additional indicators
      • Production system
      • Local procurement
        • 🇧🇪Score by country - Belgium
      • Environmental policy
        • Country score
      • Circularity of packaging
        • 🇧🇪Upstream Score
        • 🇧🇪Down stream Score - Belgium
        • 🇧🇪Score by material - Belgium
        • 🇧🇪Ratios by format - Belgium
      • Threatened species
  • Implementation
    • Information to be collected
    • 🇧🇪Calculation tool
    • Graphic charter
      • Logo
      • Pictogramme
      • Colors
  • Find out more
    • Changelog
    • Contact
Powered by GitBook
On this page
  • Environnemental Performance Index
  • Standardization
  • Scores by country
  • Score calculation
  • Sources
  1. Methodology
  2. Additional indicators

Environmental policy

Rule for calculating the origin score

PreviousScore by country - BelgiumNextCountry score

Last updated 1 year ago

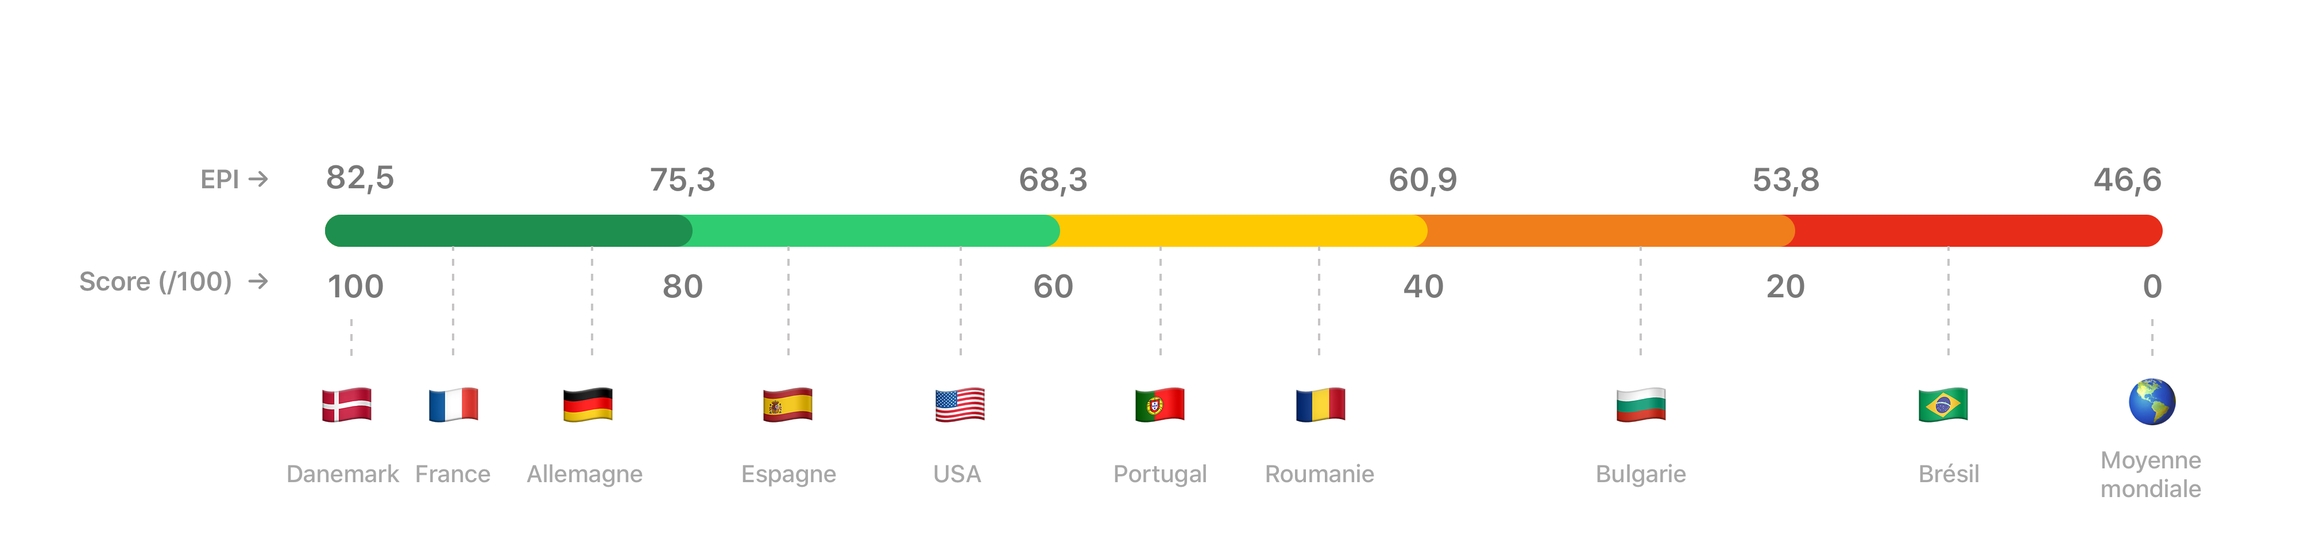
The evaluation of environmental policies is referred to hereafter as the "origin score". Its aim is to reflect the producer country's environmental policy (discharge standards, electricity production, biodiversity, etc.). It is based on the work of the Environmental Performance Index (EPI).

Environnemental Performance Index

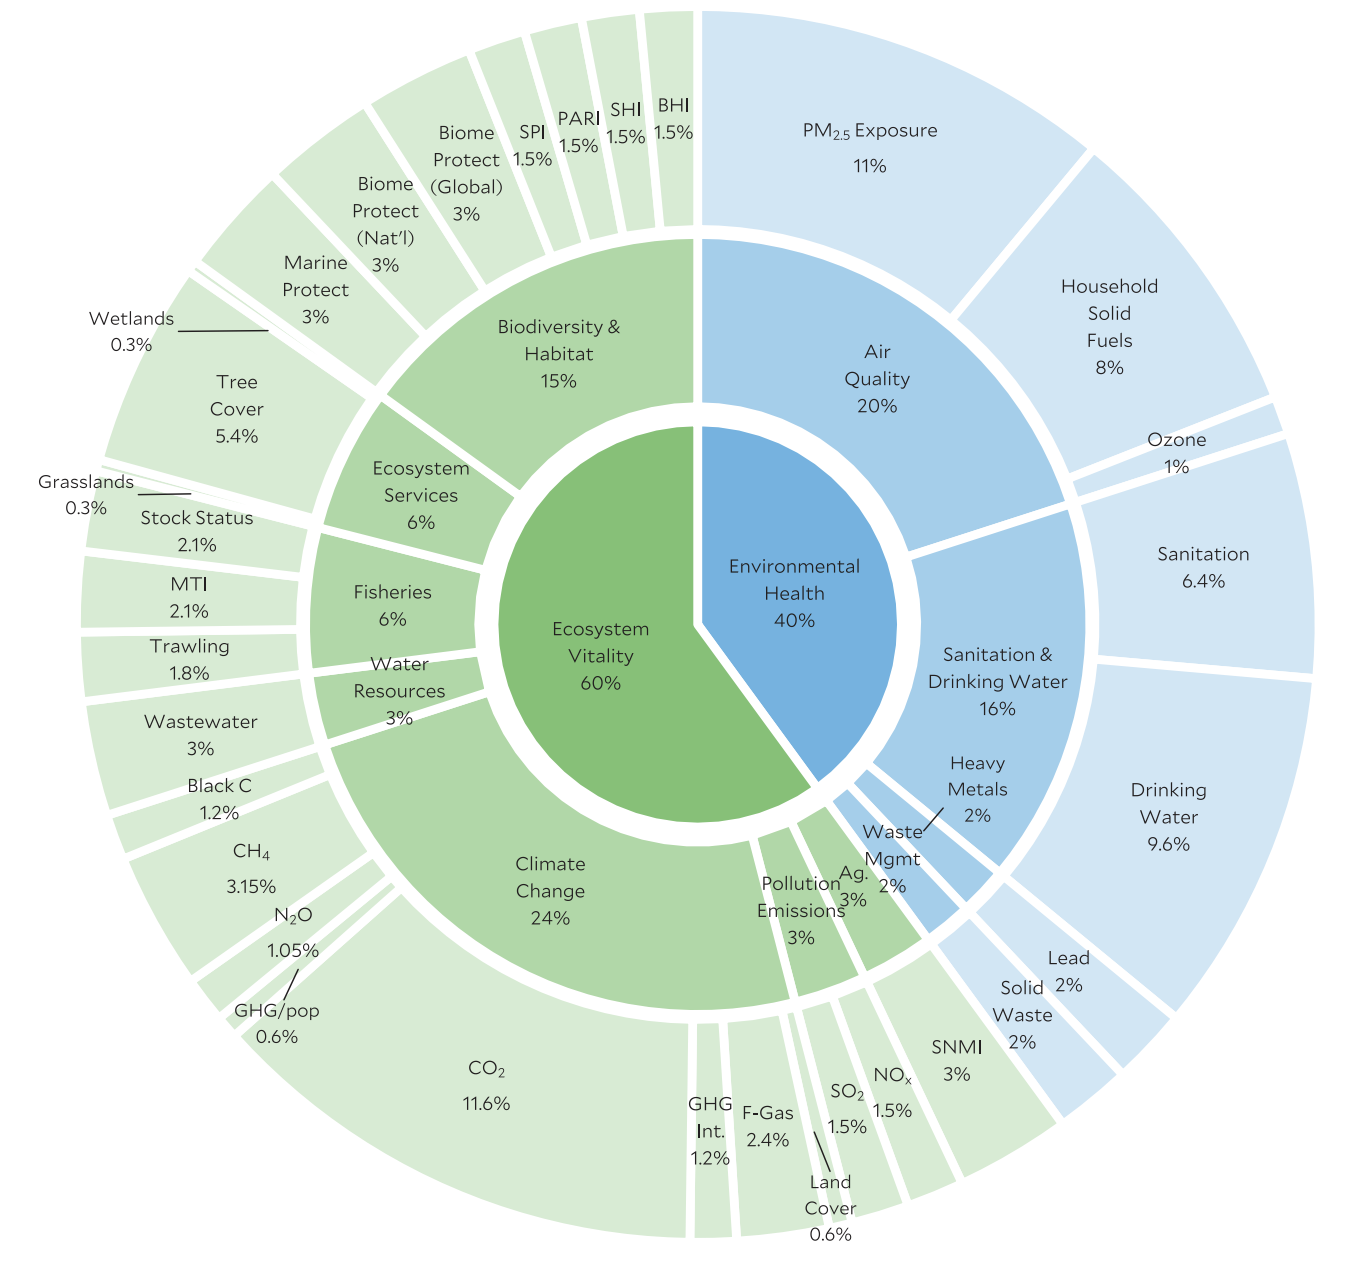
The EPI is an index created by researchers at Yale University and Columbia to determine the performance of each country's environmental policies and its impact on the environment.

An update is published every two years on the site: https://epi.yale.edu/

It brings together 180 countries and aggregates 32 performance indicators grouped into 11 categories:

  1. Air quality

  2. Water quality

  3. Heavy metals

  4. Waste management

  5. Biodiversity & habitat

  6. Ecosystem management

  7. Peach

  8. Climate change

  9. Pollutant emissions

  10. Agriculture

  11. Water resources

Standardization

The original score (out of 100) is normalized on a scale of 0 to 100 with:

  • 100 → the highest rated country's EPI

  • 0 → the world average of EPI

This means for example that:

  • The country with the best EPI (Denmark) has a score of 100/100

  • A country that has EPI less than or equal to the world average at a score of 0/100

The normalization formula is as follows:

score=x−epi‾epia−epi‾∗100score = \frac{x-\overline{epi}}{epi_a -\overline{epi}}*100score=epia​−epi​x−epi​​∗100
  • xxx is the EPI of the concerned country

  • epi‾\overline{epi}epi​ is the world average of EPI (46.6 in 2020)

  • epiaepi_aepia​ is the country with the best score (Denmark - 82.5 in 2020)

The score is bounded in the interval [0, 100]

Scores by country

The original scores calculated using the above methodology are available here :

Score calculation

The following formula makes it possible to obtain the origin score on 100 points, taking into account nnn ingredients involved in a recipe:

score=∑i=1nai∗piscore = \sum_{i=1}^{n}a_i*p_iscore=i=1∑n​ai​∗pi​

nnn the number of ingredients aia_iai​ the origin score associated with the country pip_ipi​ the percentage of the ingredient present in the recipe

The sum of the percentages is always equal to 100: ∑i=1npi=100\sum_{i=1}^{n}p_i = 100∑i=1n​pi​=100

The original score is integrated into the overall score of the product in the form of a bonus / penalty: between -5 and +5 points. The original bonus / penalty is calculated as follows:

bonus=x10−5bonus = \frac{x}{10}-5bonus=10x​−5

xxx corresponds to the original score

Sources

Country score
Welcome | Environmental Performance Index
Logo
Indicators taken into account & weighting :
EPI match ↔︎ Score / 100